Time-Series Forecasting
2024 / 04 / 22
Intro
While at EO, my team's ongoing focus was on providing customers with critical insights on the health of their charging station network and their vehicles. Of all the data points that we collected and displayed, the most important one for our customers was their energy usage. The ability to display a detailed forecast was critical. While the focus of our Data team was very much on using the highest granularity data for prediction, I wanted to spend some time exploring cheaper to train and use alternatives. There is no shortage of great papers and models dealing with time-series predictions, so I wanted to spend some time on that problem. Mostly for fun, but also to learn something new.
Scope of Work
In this blog post I wanted to focus on the following areas:
1. The problem
2. Linear regression model (& Prophet)
3. Custom MLP based model
Now onto the problem that prompted this whole exercise.
The Problem
The data I used consisted of completed charging sessions, which contains start and stop time stamps, but isn’t time-series. The actual time series data for a year weights a few GBs and pulling it from our reporting database for an experiment would have made me very unpopular with the Data team. In comparison, a year’s worth of charging session data is just a few hundred thousand rows, or a few MBs.
Due to the discrete nature of the data, I condensed it to the totals per day. This gave me a total energy consumption value for each day of the year. The upside was that I now had some time-series data. The downside was that I condensed hundreds of thousands of rows into only 365. To learn more about the data and whether it can be used to train a simple model I went through the following steps:
1. Select my features & target.
2. Evaluate the selected features and their correlation to the target.
3. Determine if there is any correlation between the energy consumption values at t and t - lag, where t was the time of the target and the lag was the delay in days.
The data after the pre-processing stage contained the following features: 'Day Sin', 'Day Cos', 'Energy Consumed Total’, ‘Active Chargers Count’, ‘Sessions Count’
The results were interesting, but pretty obvious in hindsight. There was a very strong correlation between the energy consumed and the number of active charging stations, which makes sense. Surprisingly there wasn’t a strong correlation between the energy consumption and the number of sessions. I included the ‘Day Sin’ and ‘Day Cos’, because the data exhibited seasonal trends.

Autocorrelation score between t and up to 14 days in the past.
The data appeared to show strong correlation between today’s energy consumption and the same day a week or two in the past. Again, kind of obvious in hindsight, but it was good to confirm it. Then I wanted to check the autocorrelation score for each data point, compared to the same day a week ago.
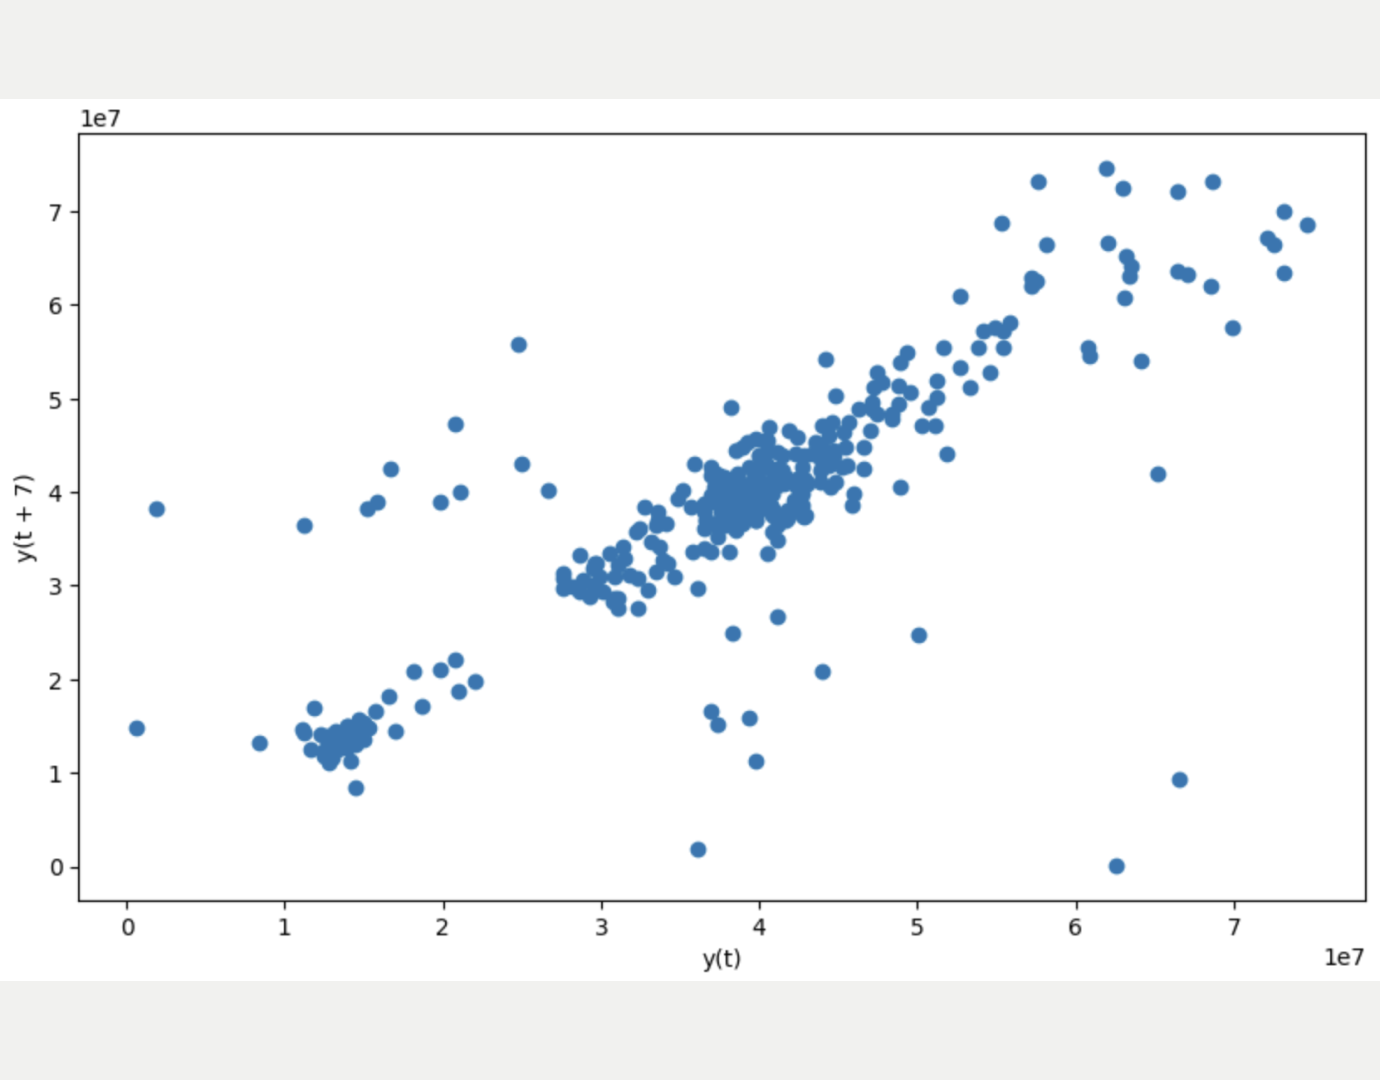
The autocorrelation score for each data point at t-7.
It was encouraging to see that, in general, the same day a week ago was a good indicator of today’s usage. There were some significant outliers, however, which is something that I sadly realised is difficult to work around, given the small number of data points. Now on to the models.
Linear Regression
First the good old Linear Regression model. Given the strong correlation between the energy consumption and the total number of chargers, I thought linear regression may be enough to solve the problem with a few lines of code.
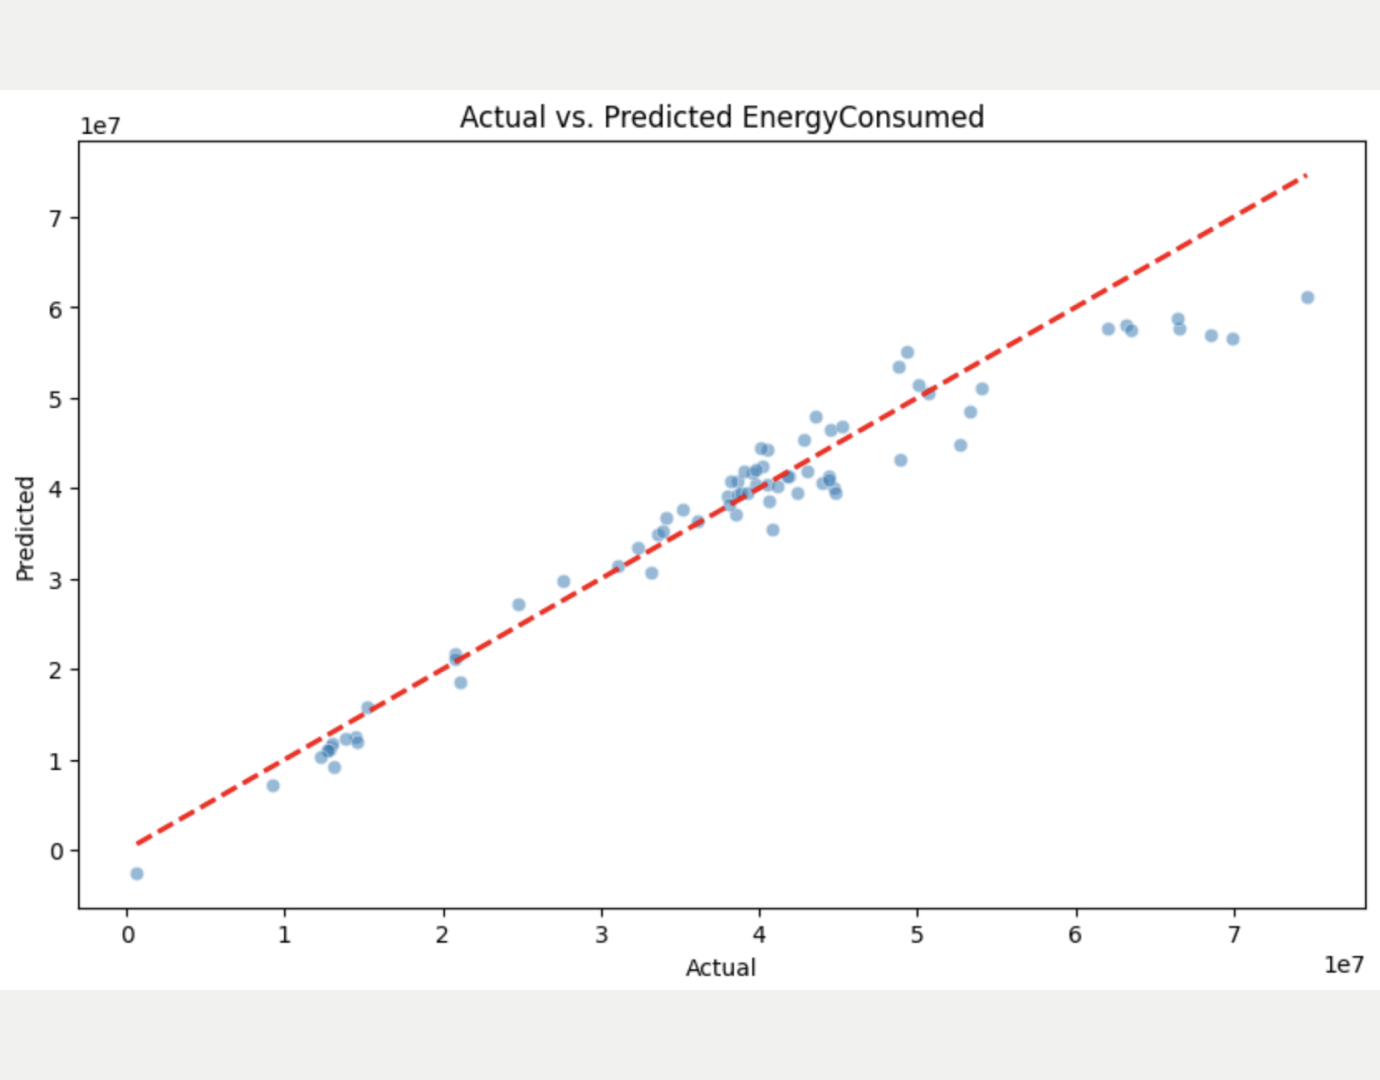
Linear regression model predicted vs actual values
The results were surprisingly good. Worth mentioning is that the scale of the data was in the tens of thousands. The linear model achieved a MAE of 6,678 and a MAPE of 14.4% when presented with unseen data. There were a few outliers towards the more extreme values, which likely contributed to the large Mean Absolute Error (MAE). While the Mean Absolute Percentage Error (MAPE) wasn’t exceptional, it was still pretty good, given the highly condensed nature of the data.
As an aside, I also checked Prophet out, but didn’t really want to spend a lot of time on it. The results I got were not great, so I just wanted to mention it for completeness sake. The model picked up an upward trend in the data, which I didn’t really buy. I’ll use Prophet for my projected revenue figures in the next company all hands.
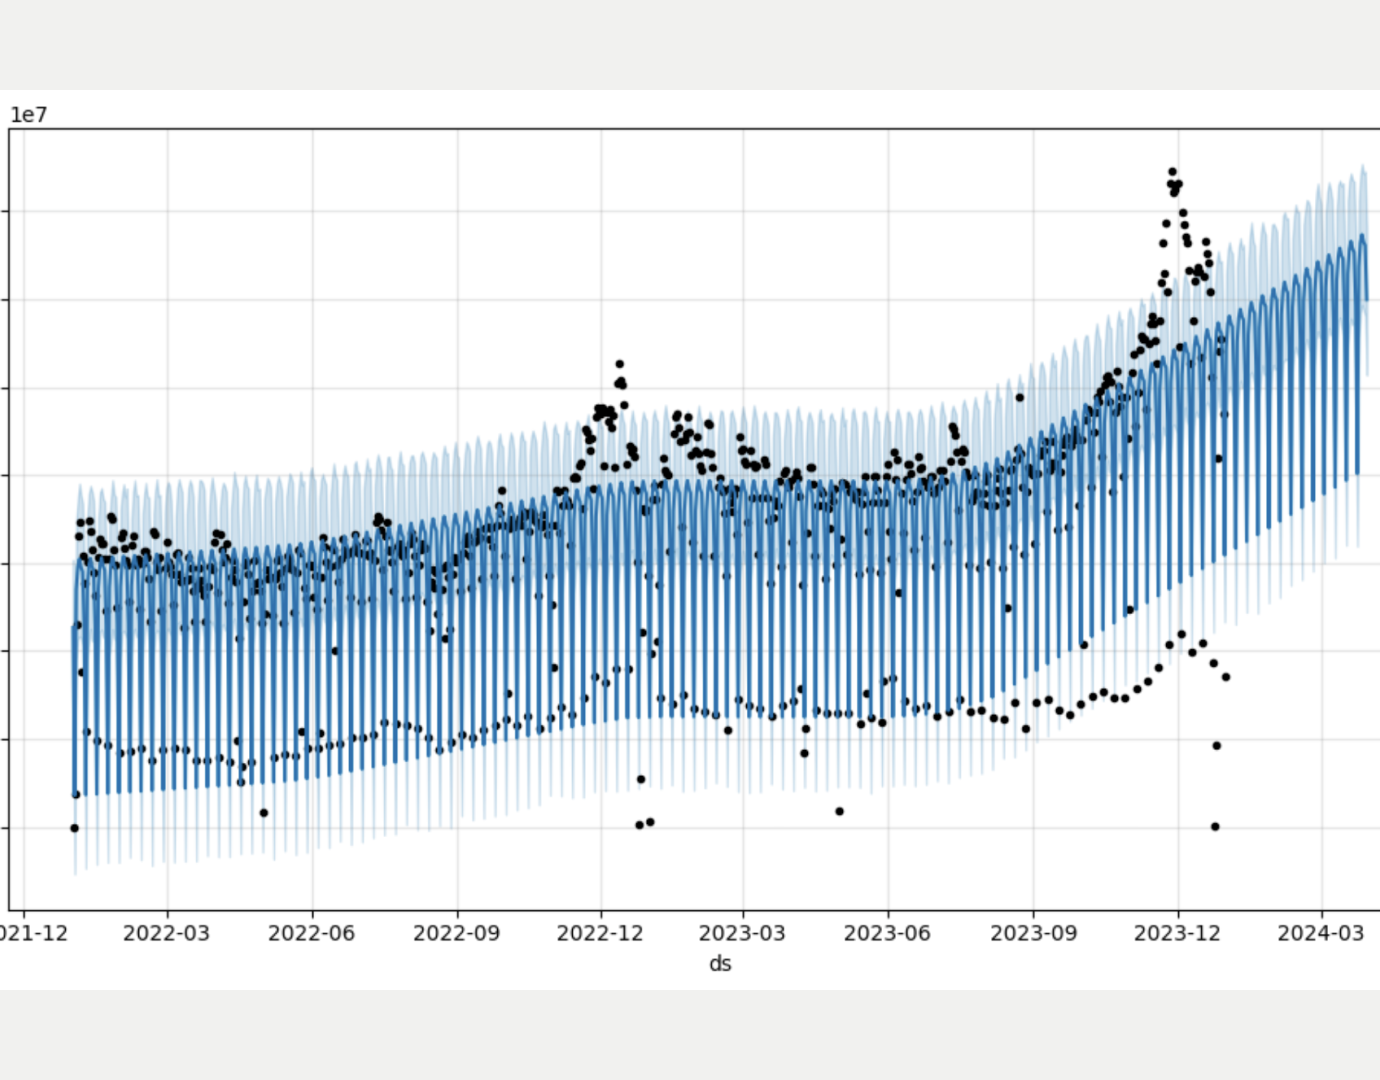
Time-series prediction using the Prophet model.
Custom MLP Based Model
Finally, I wanted to check if I can improve the accuracy of the linear model, by writing my own MLP based model for predicting the future values. I don’t think there’s complex enough relationship between the features to warrant an MLP model, but it’s all for learning, so why not.
After lots of tweaks and adjustments, I finally settled on a decent architecture for the model. The model consisted of 1 x Input, 2 x Hidden and 1 x Output layers. The size of the hidden layers was 50 neutrons, the activation function a Tanh and a standard batch normalisation pass at each layer. In total, 3352 parameters.
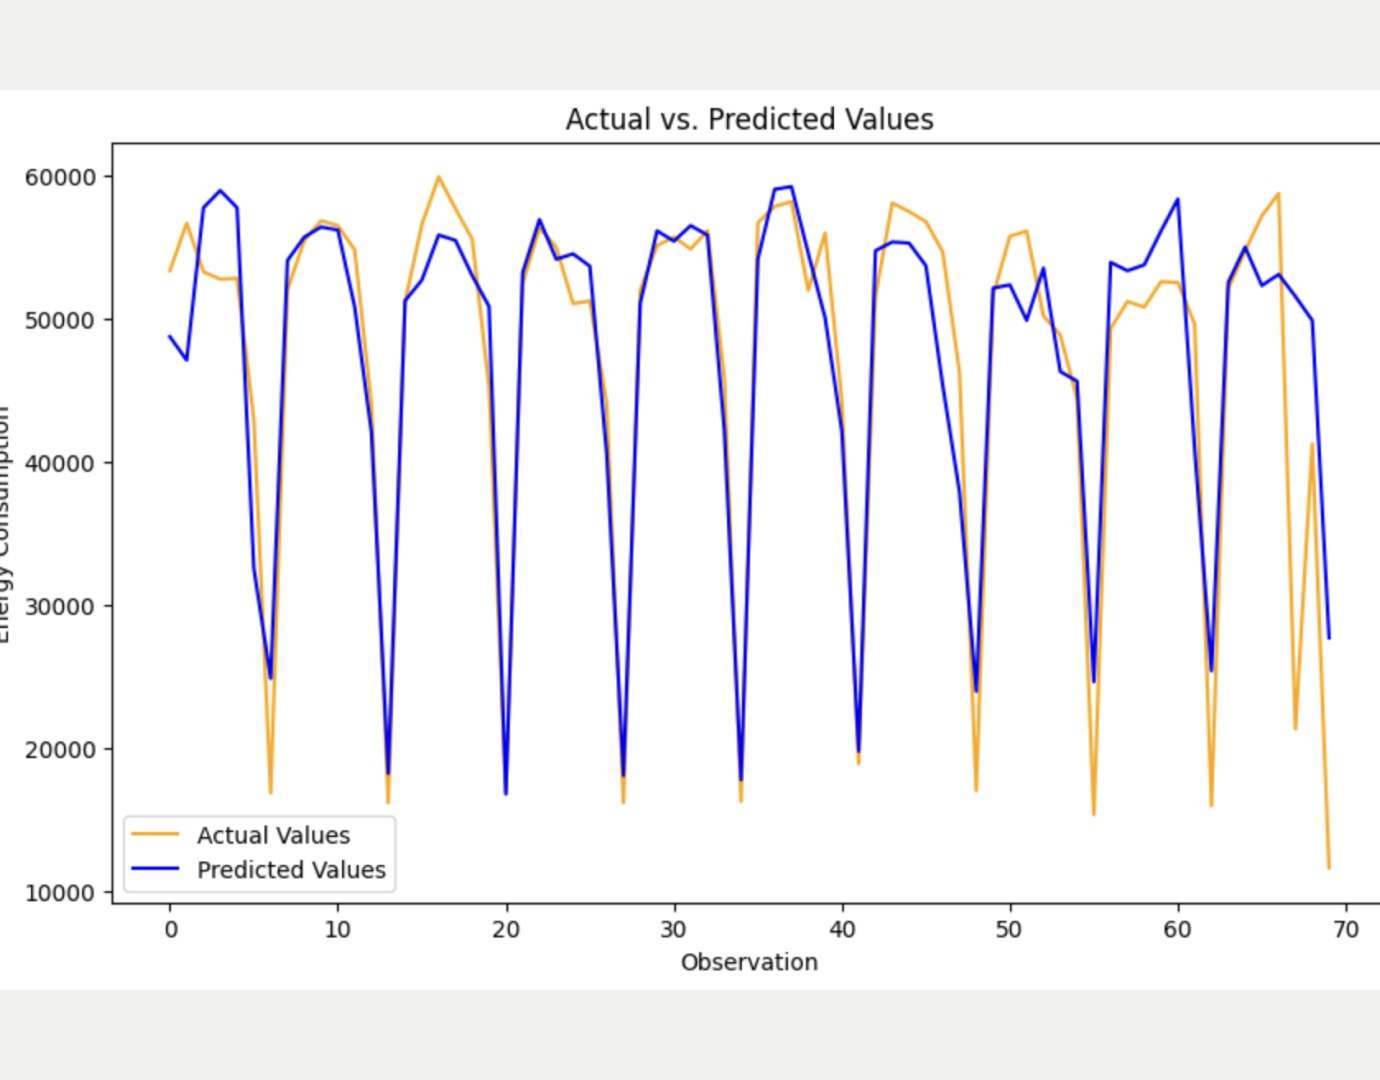
Time-series prediction using my custom MLP model.
The results were a bit better, compared to the Linear model, but not enough to justify the amount of time I spent tweaking the network’s parameters. The model achieved a MAE of 4,038 and a MAPE of 11.7% when presented with unseen data.
Conclusion
Anything below 10% would have been great and perhaps there is scope to further improve this model, but I decided to park it for now and use the learnings in my next little project. This exercise did highlight the importance of setting the correct scope and outlining the right expectations from the onset. The MLP based model ended up taking up about 12 hours, which isn’t terrible, but compared to the 30 minutes it took to set up the Linear model, the barely 3% improvement in the MAPE is hard to justify. On the bright side, I did have a lot of fun trying to optimise the model to beat its Linear counterpart. The Jupyter notebook of the MLP model with the code, can be found on my GitHub page.


